Mandelbrot in MATLAB
Along the same vein as my last blog post, I decided to see how few lines of code it would take to come up with some cool Mandelbrot pictures.
The Mandelbrot Set is a set of numbers described by a very simple mathematical statement. The set is famous in mathematics for its properties of self-similarity, as well as other cool facts that you can find out about on its Wiki page if you’re interested. Here’s a visualization of the Mandelbrot set.
What exactly is going on in the above image? To answer this, we very briefly discuss what is the Mandelbrot Set. If you’re already familiar or don’t care to see the math, skip this section.
What is the Mandelbrot Set?
We begin by picking a complex number \(c\); let’s say \(c=-1\). Now we generate a sequence of numbers based on the following rules:
- The first number is \(0\)
- If the \(n\)th number is \(z\), then the \((n+1)\)th number is \(z^2+c\).
In our example, the second number would be \(0^2+(-1)=-1\), then the third number would be \((-1)^2+(-1)=0\), and so on. The Mandelbrot Set is the set of all complex numbers \(c\) such that, when you follow the rules above to create a sequence based on \(c\), every number in the sequence has magnitude less than or equal to \(2\). (From now on, I’m not going to use the word “magnitude”, I will just say greater than or less than \(2\)). Our example, \(c=-1\), generated the sequence \(0,-1,0,-1,0,-1,…\), so \(-1\) is certainly in the Mandelbrot set. However, if we chose \(c=1\), then the generated sequence would be \(0,1,2,5,26,…\), so \(1\) is not in the Mandelbrot set.
With this definition in mind, we can visualize the Mandelbrot Set by painting it on the complex plane - if a complex number is in the set, we paint it white, otherwise we paint it black. That process gives us this image:

But wait, how can we tell for sure whether a complex number will generate a sequence that hits a number greater than \(2\)? After all, we can’t check the whole infinite sequence! In my program, I check only the first \(10,000\) numbers in the sequence; the error from this approximation is very small, and imperceptible in the image.
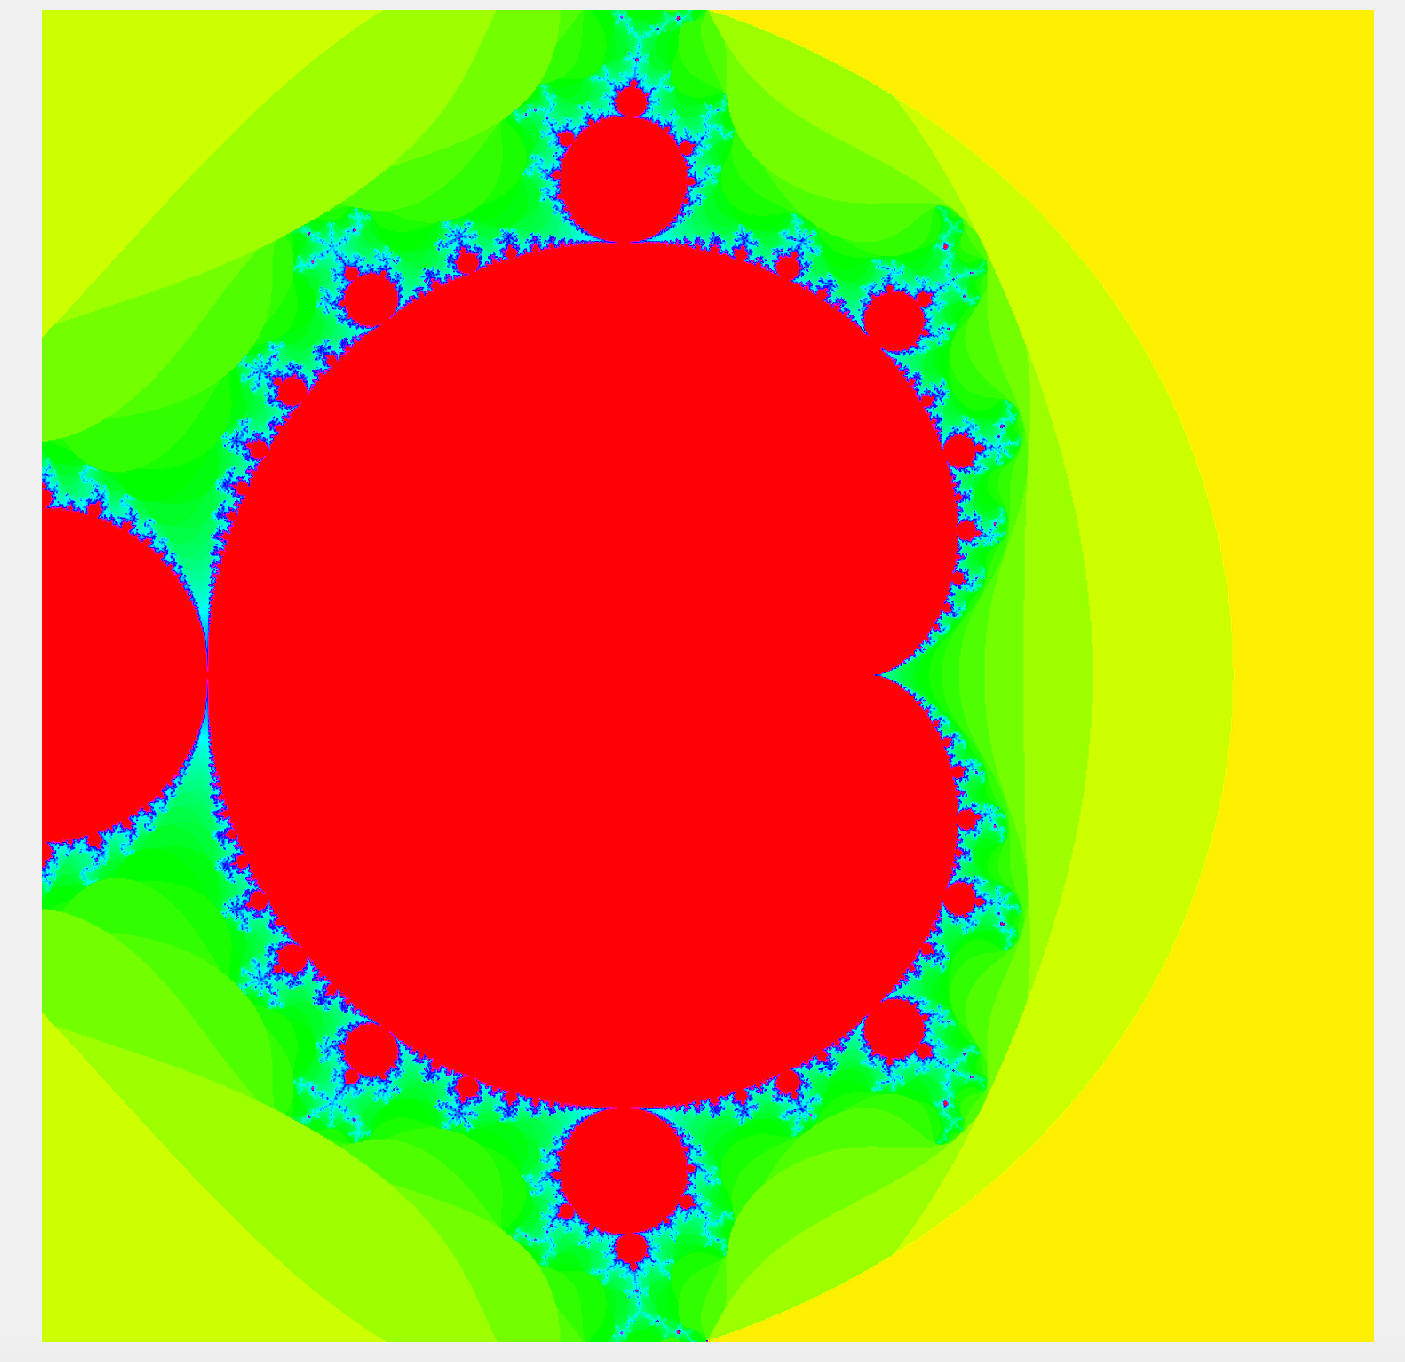
With this in mind, it’s time to make the picture more colorful! Remember that the sequence for \(c=1\) is \(0,1,2,5,…\). In this sequence, the magnitude became greater than 2 by the fourth number of the sequence (which saved us from having to check 9,996 more values). However, for certain other complex numbers, the sequence doesn’t become greater than \(2\) until much later - for example, the sequence generated by \(c=0.254\) doesn’t become greater than \(2\) until the \(48\)th number of the sequence! With this in mind, we can do the following: instead of coloring every number that isn’t in the Mandelbrot Set black, we can color them based on how long it takes for their sequence to become greater than \(2\). Once that idea is converted to code, we get the colorful image at the top!
The MATLAB implementation
The program I wrote is only about 75 lines of MATLAB (available here), and allows the user to zoom into the image, toggle the colormap, and switch between viewing the Mandelbrot set and a Julia set.
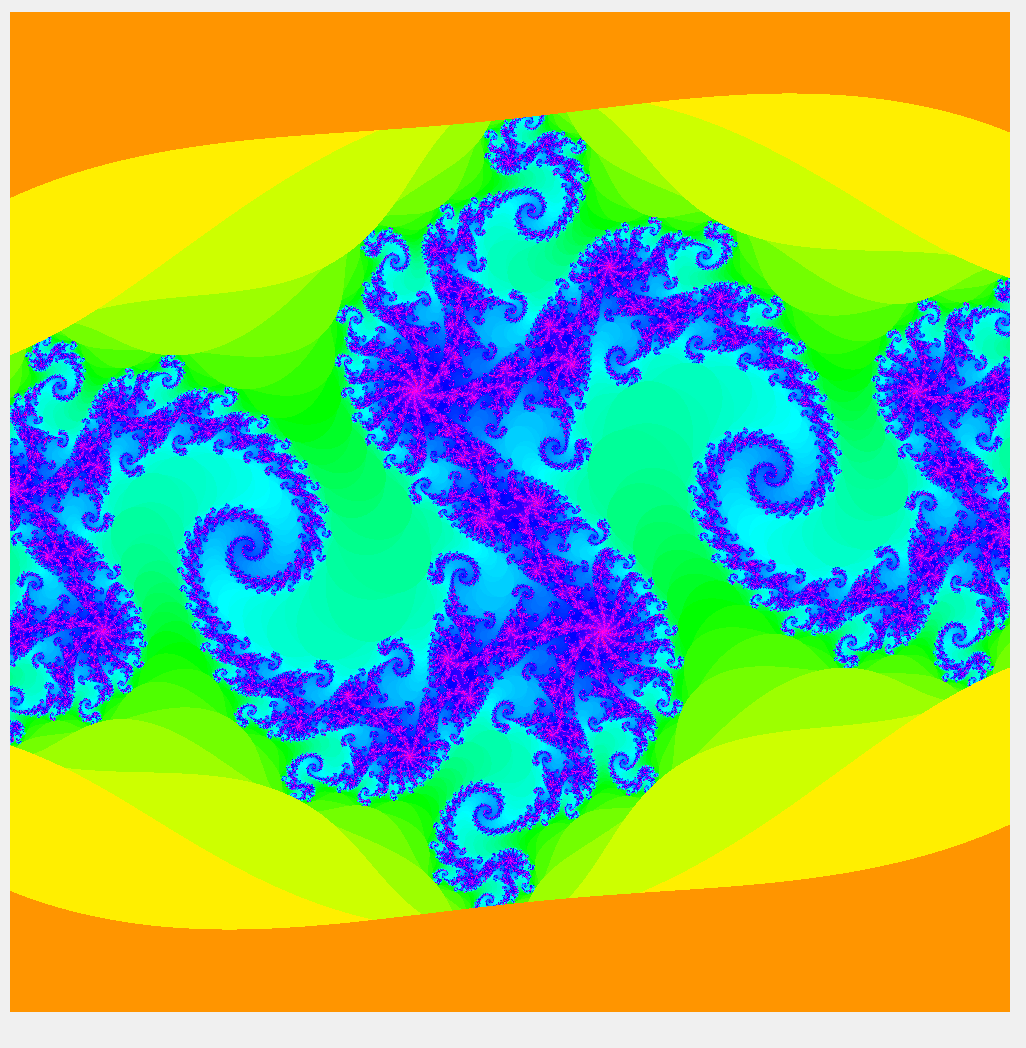
Zooming in too far will make things bad because of floating point imprecision (this is fixable, and there is a lot of discussion about this on the Wiki page), but before that error kicks in, we can explore quite a bit, and begin to see the self-similarity. If you’re looking for a cover for your next album, this is the program for you!
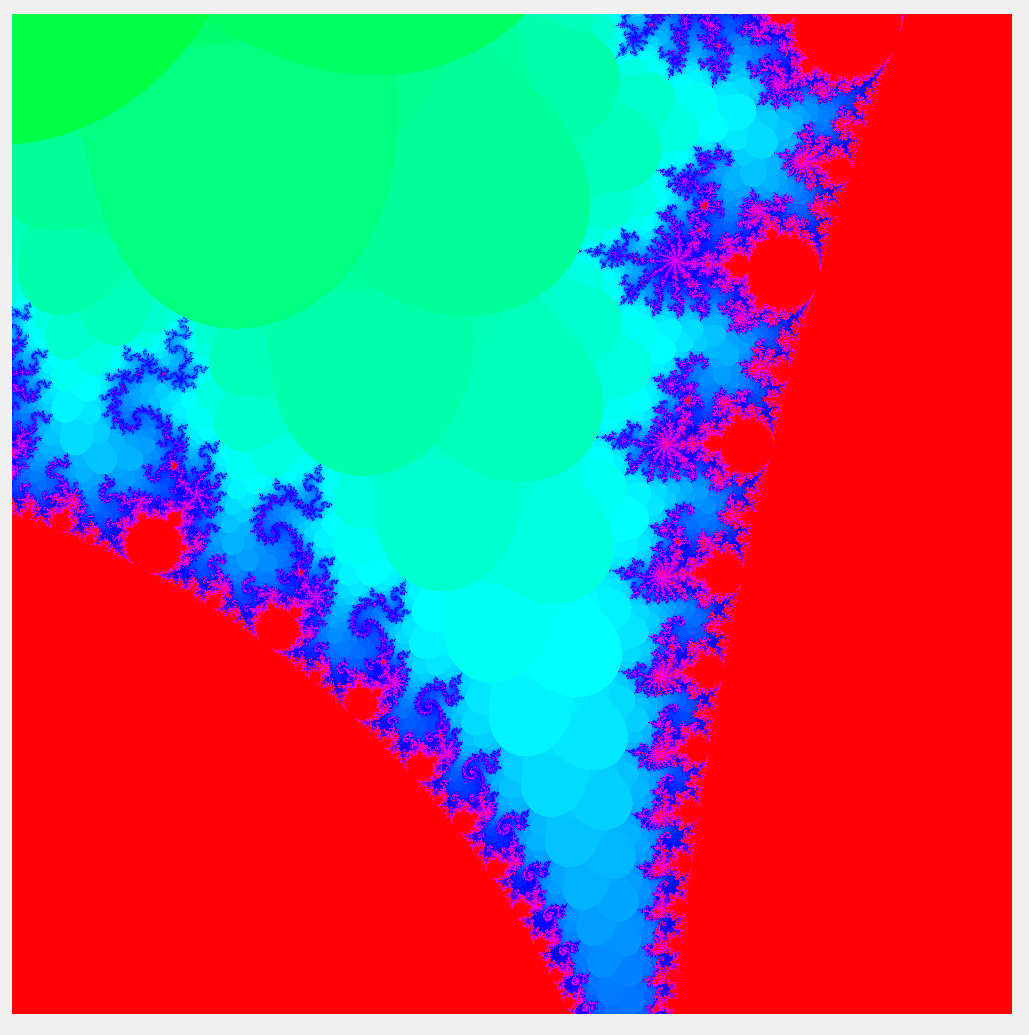
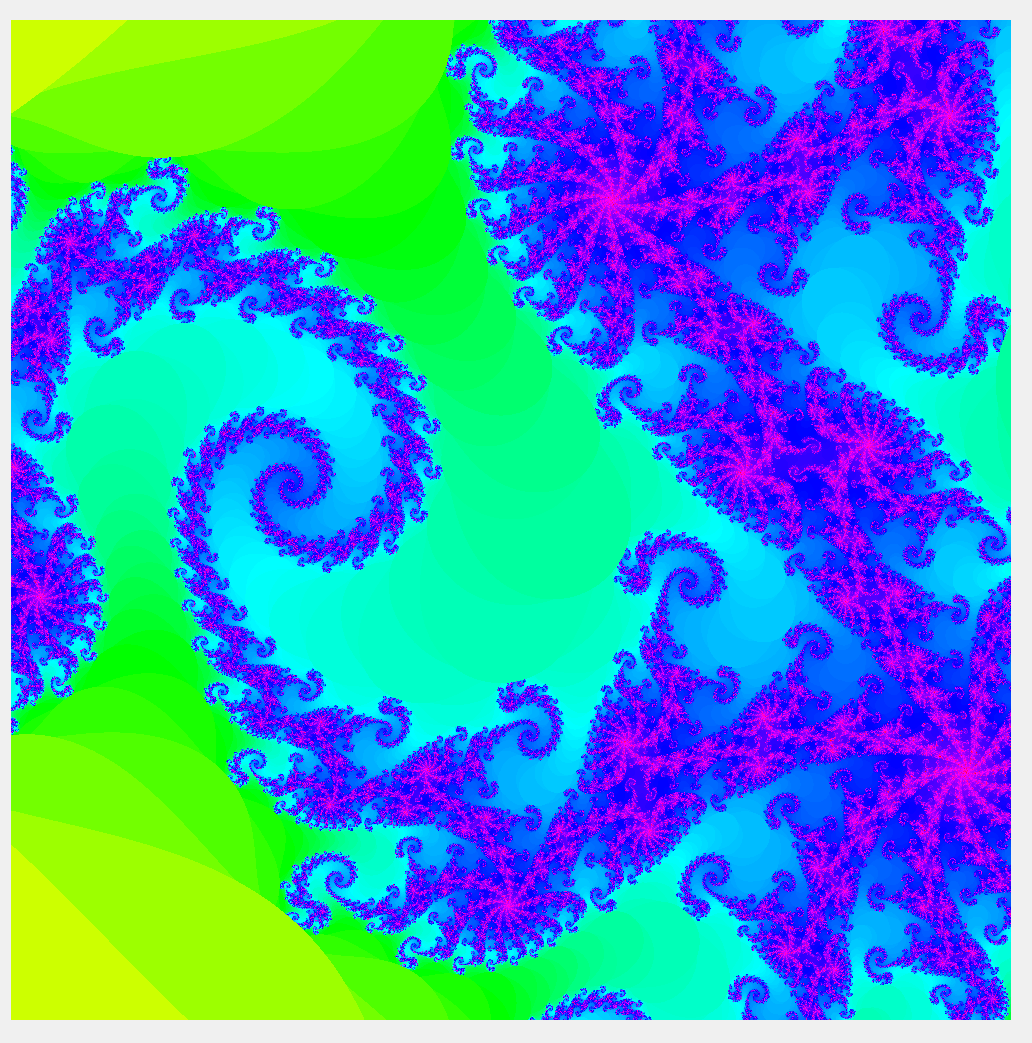
This toy project began as a way to learn MATLAB, and in doing so, I also learned about colormaps. In the program, you can also toggle between 9 different colormaps. Here are the seasons!

Summer |

Autumn |

Winter |

Spring |
The code can be improved in many ways - feel free to download and play with it, and find a cool desktop background in the dizzying beauty of fractal mathscapes!